Binary trading oscillators are a very important tool for navigating whether the non-trending market is overbought or oversold. But what exactly is an oscillator? How do you use them correctly? In this guide, we will give you a detailed overview and provide you with the best tips and tricks for trading with oscillators to make more profits in binary options trading.

Most important facts about Binary trading oscillators:
- Oscillators in binary trading are technical indicators used to identify overbought or oversold conditions, helping traders make informed decisions.
- Stochastic Oscillator, RSI, ADI, and MACD are different types of oscillators, each serving unique purposes in trading analysis.
- The Awesome Oscillator, with strategies like Twin Peaks and Saucer, offers additional methods for traders to analyze market momentum.
- They play a crucial role in technical analysis, as oscillators help to identify potential reversals in the market and provide signals for trend continuation or reversal.
What is a Binary Indicator?
What you will read in this Post
Let us start with the basics: You may ask yourself, what is a binary indicator? Here is a short definition:
Binary indicators are useful trading tools that help price action traders understand what is happening in the market and predict what will happen next. In particular, they provide an objective view of market movements and trends by analysing historical data and identifying patterns from it.
A binary trading indicator is basically a mathematical model based on certain criteria and formulas. It can take into account various aspects of the market, such as volume, price, time and other relevant factors. By combining this data, the indicator can generate signals that tell the trader when it is potentially profitable to open or close a position.
What is a binary trading oscillator?
A binary trading oscillator, on the other hand, is a specialised technical analysis tool designed to give traders insight into market momentum. Unlike simple indicators that primarily track price movements, oscillators dig deeper, measuring the speed and change of those price movements. In doing so, they help traders identify potential turning points in the market, often indicating overbought or oversold conditions.
When the market is overbought, it suggests that a potential downturn may be ahead, while an oversold market may indicate an imminent upward movement. Oscillators work best in sideways or range-bound markets, where prices move within a certain range for an extended period of time. By providing a clearer picture of market momentum and potential reversals, binary trading oscillators play a crucial role in helping traders make informed decisions, optimize entry and exit points, and improve their overall oscillators trading strategy.
Best Binary trading oscillators – Examples and how to use them
Following are the binary oscillators you can use for the best trading experiences:
#1 Stochastic

The stochastic will appear at the bottom of your chart when plotted. The lines move along a scale of 0 to 100, measuring how overbought or oversold the market is.
- Two lines exist, one being quicker than the other. These two horizontal lines that are frequently ranging (sometimes above sometimes below) are between points 20 and 80.
- The market is regarded to be “overbought” when the lines cross above 80.
- These two horizontal lines that are frequently ranging (sometimes above sometimes below) are between points 20 and 80.
- The market is regarded to be “overbought” when the lines cross above 80. It’s called “oversold” if it’s below 20.
The stochastic oscillator, as you might think, aids in the detection of trend reversals. When you observe the lines below 20, you may usually expect an upward reversal. Thus you should buy. When the lines are over 80, a downward reversal is likely. Thus you should sell.
These are merely suggestions. The details of your system will determine how you use the stochastic or any other oscillator.
(Risk warning: Your capital can be at risk)
#2 Relative Strength Index (RSI)

The RSI and the stochastic oscillator are incredibly similar. When you plot it on your chart, you’ll see a line fluctuating between (or above or below) two horizontal lines, which look identical.
The scale reads 0 to 100 once more, but the lines are now at 30 and 70. This is yet another oscillator that focuses on spotting trend reversals.
#3 The Average Directional Index (ADI)
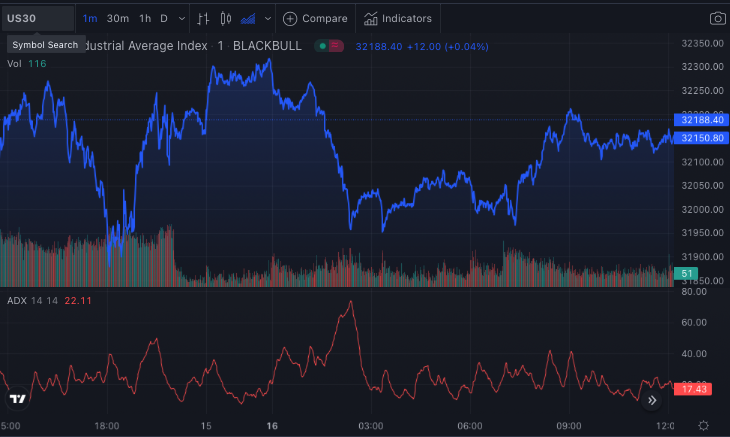
One can find the ADX or Average Directional Index Indicator at the bottom corner of the chart, like the RSI or Stochastic oscillator indicator. The ADX scale runs from 0 to 100. However, it functions uniquely. This is a measure of a trend’s strength rather than its direction.
This is a measure of a trend’s strength rather than its direction. A trend is considered weak when the ADX falls below 20. If the ADX goes above 50, you’re looking at a significant trend, whether bullish or bearish. When combined with some other indicator that can assist you in recognizing direction, the ADX is most beneficial.
However, if you’re performing Boundary or No Touch trading, the ADX alone provides a “weak trend” indication, which is enough to pick a trade.
If the line falls below 30, you should purchase, and if it rises above 70, you should sell. Traders may also check whether the price is above or below 50, which is in the middle of the oscillator, to confirm an existing trend.
#4 Convergence Divergence of Moving Averages (MACD)

You’ll see two moving averages and a bar chart with the MACD.
This oscillator identifies trend reversals. In MACD when you observe a diversion from the trendlines you created across the high and lows of candles on the chart, it implies that the situation is trend reversal and thus, a good trading opportunity for you.
This is pretty hard to understand. That’s why most newbies are somewhat hesitant to use it. MACD is not a challenging idea once you understand it, but it does require some time to explore in-depth. You can also learn several sorts of divergence trading based on the MACD.
How do you use an awesome Oscillator in Binary Options?

Without a doubt, an indicator with the word “amazing” on its label must be fantastic.
What makes the Awesome Oscillator (AO) so unique? Many traders regard this indicator as a “simplified” version of MACD. Yes, you guessed right! AO indicator is a straightforward histogram designed to reflect market momentum, confirm trends, and spot potential trend reversal points.
What is the mechanism behind it?
- The gap between the 34-period Simple Moving Average values and 5-period Simple Moving Average is represented using Awesome Oscillator.
- The MAs are determined utilizing the candlestick’s midpoints, not by using the opening or closing prices. Around the indicator’s baseline, the generated values are shown as red and green bars.
- A green bar indicates that the value is higher than the one before it. A red bar means it’s lower than the one before it.
- The short-term trend is more prominent than the long-term trend when the indicator’s values are above the zero line.
- Meanwhile, the short-term trend is declining faster than the long-term trend when the histogram is below the zero line. Traders can use the Awesome Oscillator in a variety of ways as a result of this.
Awesome Oscillator strategies

Because the AO indicator is so versatile, traders may use some Awesome Oscillator strategies with any trading instrument and timeframe.
#1 Twin Peaks
The formation of two peaks in the Awesome Oscillator is another indicator to keep an eye on as it implies a trend change is on the way.
Traders must be aware of the following in order to benefit from this signal:
- When two peaks from below the zero line, this is known as a Bullish Twin Peaks. It’s worth noting that the second peak should be higher than the first, but both of them (along with the bars in between) must remain below the baseline. A green bar should appear after the second peak.
A trader can also combine these tactics to achieve more significant outcomes:
- When the two peaks form above the baseline, a Bearish Twin Peaks signal is generated. A red bar follows the second peak, which is lower than the first. Both the peaks and the bars between them must be higher than the baseline.
When there are two peaks and the first bar on the screen, it’s a sign that traders can trade.
#2 Saucer
The Saucer strategy anticipates a persistence of the trend rather than a reversal. It takes into account three bars and can show faster changes in momentum.
When using this technique, take note of the following:
- The indicator’s lines should stay above the zero line for a Bullish Saucer signal. After a green bar, there must be two consecutive red bars (the second one must be beneath the first one).
This means that the price is rising:
- To achieve the Bearish Saucer signal, the Awesome Oscillator bar should be beneath the zero bar. After a red line, two consecutive green lines show a bearish saucer signal (the second line should be above or higher than the first one).
#3 Baseline Crossover
The zero-line crossover is the first and perhaps most apparent strategy you can try.
The approach’s guiding concept is as follows:
- When the lines pass from below to above the baseline, this is known as a bullish crossing (a bullish crossing). This could signify a “Buy” or “Higher” position.
- When the lines drop from above to below the zero line, this is known as a bearish crossing (a bearish crossing) which indicates “Sell” or “Lower” position.
This may be an opportunity to “Lower” or “Sell” the asset.
Awesome Oscillator for trading Binary Options with a strategy
The Awesome Oscillator may be used with any trading instrument, making it ideal for Binary Options short-term trades. You can use AO with Moving Averages, for example, to create a potent Binary Options strategy. Let’s look at how to use it more closely.
(Risk warning: Your capital can be at risk)
Awesome moving averages and Oscillator strategy
To double-check the signal for a trend reversal, combine the Awesome Oscillator with two Moving Averages with periods of 5 and 34. You can put it to use by doing the following:
- Use the Awesome Oscillator’s default settings to get started
- Select a Simple Moving Average with a 5-period period
- Choose a different hue for the next Simple Moving Average with a 34-period
To carry out this process, a trader must look for a crossing of the two MAs along with a crossover of the Awesome Oscillator’s baseline:
- It could signal to trade higher if the rapid MA (5) crosses the delayed MA (34) from underneath to above, the AO will show a positive crossing.
- However, if the rapid MA (5) passes the delayed MA (34) from above to below, the AO will show a bearish crossing. When this happens, one should trade lower to avoid losses.
Divergence
While the Awesome Oscillator is a valuable tool, no indicator can promise 100 percent correct forecasts or profitable results. A divergence might occasionally happen, which implies the indicator indicates the opposite of the market — for example, a decrease when the demand rises. It’s always a good idea to double-check all incoming signals and use risk management tools in any approach to protect your money.
What is the technical indicator oscillator in Binary Options?
Traders use technical indicators as a tool to forecast market movements based on continuance patterns. Traders use technical oscillators on graphs and charts with the assumption that they can reveal market patterns as they emerge, allowing traders to begin and exit deals with a better understanding of future market moves.

There are a variety of technical indicators that can be employed, but some are better suited to binary options trading, so we’ll focus on those.
How does technical Oscillator work?
- Technical analysis is a trading technique that evaluates investments and uncovers trading opportunities by analyzing trends and patterns derived from market activity– for example, price movement and volume.
- Technical analysts use trading signals, analytical charting tools, and trading signals to analyze a security’s strength or weakness, as opposed to fundamental analysts who try to establish a security’s inherent value based on financial or economic facts.
Technical analysis may help any security with historical trading data. This includes futures, stocks, currencies, fixed-income, and various assets. In this guide, we’ll use stocks as an example, but you can apply principles to any type of security.
- Technical analysis is more common in commodities and FX markets, where traders are more concerned with short-term price swings.
- Technical indicators, or “technicals,” concentrate on past trading data such as trading volume, price, and open interests—the value isn’t calculated using business fundamentals such as earnings, revenue, or profit margins.
- Technical indicators are typically employed by active traders since they are designed to examine short-term price changes. Still, long-term investors can utilize them to determine entry and exit locations.
Categories of technical indicators
The following are the two types of technical indicators:
- 1. Overlays: On a stock chart, technical indicators are on top of prices on the same level as the prices.
Moving averages and Bollinger Bands are two examples of this type of analysis.

- 2. Oscillators: These technical indicators are displayed above or below a price chart and oscillate between a local minimum and maximum. The stochastic oscillator, MACD, and RSI are all examples of this type of indicator.

What is technical analysis for Binary Options?
Technical indicators are applied to charts to examine market movements in binary options technical analysis. Binary options traders employ technical indicators to look for trends and changes in base assets, which they can then utilize to make trading choices.
Technical indicators are classified into one of four groups:
- Trend – these indicate the market’s direction. Oscillators are another name for them.
- Momentum — momentum indicators indicate how strong a trend is and where reversals are likely to occur.
- Volatility – Volatility indicators illustrate the magnitude of market changes and the rate at which prices change.
- Volume – this refers to the number of items purchased and sold. They are not required while trading on Nadex because the settlement value of your contracts is unaffected by volumes on Nadex’s exchanges. However, the price action of a Nadex contract can be influenced by volumes in the underlying market (and hence its movement).
(Risk warning: Your capital can be at risk)
Types of technical indicators
The best five technical indicators to employ while trading binary options contracts are- RSI (relative strength index), ATR (average true range), Stochastics and MACD (moving average convergence/divergence)
#1 Moving averages – Trend Indicator

Traders use moving averages to confirm a trend based on recent price activity. Because the data is regularly revised and the new data becomes available every time, they’re termed moving averages. The two forms of moving averages are simple (SMA) and exponential (EMA). The fundamental ones are SMAs, which calculate the mean average of a set of numbers.
These values are usually the market’s closing price, implying that the average is based on previous price data, making it slower to react. EMAs also use historical data. However, they give the latest values and a higher weighting, accounting for a more significant proportion of the average. As a result, the EMA becomes more useful for traders interested in short-term contracts.
Moving averages are frequently employed in conjunction with other indicators to provide traders with a complete view of market activity. At any one time, you can use a variety of technical indicators on your Nadex charts.
#2 Average True Range

- Indicator: Volatility
- The actual average range (ATR) is a volatility indicator. The larger the ATR, the more volatile the market.
- The ATR is calculated by analyzing the asset price range over a specified time – typically, a 14-day moving average is used to calculate these numbers.
- The ATR can be highly beneficial when trading binary options contracts because it can predict how much a market will change.
- The ATR can’t tell you the direction in which the market is moving and how volatile it is. High volatility implies there are a lot of opportunities, but it also means you have to manage your risk because markets can go any way. Learn how to create a risk management strategy that is thorough.
#3 Moving average convergence/divergence

- Indicator: Trend
- A fast line, a slow line, and a histogram are the three trend indicators that makeup moving average convergence/divergence (MACD).
The indicator’s purpose is to indicate how the two moving averages are related. The primary thing traders look for when using MACD is for the lines to converge, as this can signify the emergence of a new trend. When they cross over each other, the trend has shifted, and the line will start to diverge. In binary options trading, MACD may be used to predict how often or which way markets will shift, enabling you to select the optimum strike price.
#4 Relative Strength Index

- Indicator: momentum
- The relative strength index (RSI) is a technique for determining whether or not a market is overbought or oversold. This can aid traders in deciding whether to purchase or sell when a trend is ready to reverse.
You can use RSI to anticipate when to make trades at the right time, allowing you to form an opinion on whether to purchase or trade a contract and opt for an expiry time for it.
#5 Stochastics

- Indicator: Momentum
- Like the RSI, this indicator can tell if a market will be overbought or oversold.
However, it is formatted slightly differently, with two lines denoting trends. When stochastic lines exceed 80, a market is likely to be overbought and reverse, resulting in a downturn. When it falls below 20, it indicates that the market has been oversold, and an upswing may be on the way.
How to use technical indicators
Technical analysis isn’t a piece of cake, but technical indicators can be an excellent tool for making forecasts and trading when done correctly. Indicators are used to detect patterns, and if you believe the patterns will reoccur, this could be a valuable form of study.
When trading with technical indicators, keep the following points in mind:
- Practice self-control: Don’t put your complete faith in any market forecasting. Use your common sense and have a trading strategy in place.
- Experiment: Do your research and uncover the technical indicators that are suited for you. Experiment with a few to determine which ones fit your trading strategy and the markets you wish to trade.
- Put in the effort: Trading necessitates dedication. Spend time getting to know the needs and the various indicators, as well as the Nadex platform and charts.
Leading vs. lagging indicators: the subtle dangers of oscillators

There is a lot of technical terminology, numerical data and analytical charts that can seem overwhelmingly complex to those unfamiliar with trading. This talk will provide an in-depth exploration of two key concepts essential to interpreting market fluctuations: leading and lagging indicators. In addition, this discussion will highlight the risks associated with over-reliance on oscillators. It is imperative to understand these elements in order to navigate effectively in trading. We will give you a thorough understanding of these critical components and their implications in trading.
The leading and lagging indicators
First of all, what are these indicators? Why should you be interested in them? These indicators are like guiding stars that help traders predict or understand market movements. However, like stars, some appear before the main event (a meteor shower perhaps?) while others appear after.
Leading Indicators
As the name suggests, leading indicators typically change before the economy as a whole does. Imagine a person who always knows the latest trends before they become mainstream. That’s your leading indicator. They offer a hint about what’s going to happen next. For example, stock prices often rise before the economy starts to improve after a downturn.
Lagging Indicators
Leading indicators are more like the person who always knows the gossip a week after everyone else. They change only after the economy has started to follow a particular trend. Think of unemployment rates; they tend to fall only after the economy has started to recover.
Now, you might wonder, “Why bother with lagging indicators if they’re always late to the party?” Good question! While they might seem like they’re dragging their feet, lagging indicators are crucial for confirming that a change in trend has occurred. They give you that added confidence in your decisions.
The Oscillating Dangers

Now, as we shift our gaze to oscillators, please pay more attention to this part. Oscillators are technical tools, and they often fall under the category of leading indicators. They oscillate (hence the name) between values and help identify overbought or oversold conditions in a market. Common oscillators include the Relative Strength Index (RSI) and the Moving Average Convergence Divergence (MACD). These tools, when wielded wisely, can be beneficial. However, as with all tools, misuse can lead to potential pitfalls.
The danger? Over-reliance. Just because an oscillator indicates an overbought market doesn’t mean it’s time to sell immediately. Markets can remain in overbought or oversold conditions for extended periods. Acting impulsively based on oscillators alone is akin to seeing rain clouds and immediately predicting a storm without checking other meteorological signs.
Moreover, oscillators can sometimes produce false signals. That’s right! These tools aren’t infallible. For example, in strongly trending markets, an oscillator might indicate an overbought market, tempting a trader to sell, but then the market keeps rising. That’s why experienced traders often use oscillators in conjunction with other indicators and tools, treating them as pieces of a larger puzzle. It’s essential to remember that no single indicator should dictate your trading decisions.
Conclusion: Oscillators are perfect for technical analysis
There are five major technical indicators that might be extremely useful when trading binary options contracts. These may easily be applied to your charts on Nadex to help you discover patterns, find trends, and make informed market forecasts.
You can investigate several other technical indicators in addition to these five, many of which might be valuable when trading binary options contracts — this is only the beginning. As you trade, you’ll develop your own set of technical binary indicator choices that suit your trading style and strategy.
Frequently Asked Questions (FAQs) about Binary trading Oscillators:
What is a binary oscillator?
A binary oscillator is a sophisticated trading tool designed to give traders a deeper insight into the market’s momentum and potential turning points. By analysing the rate and magnitude of price changes, this oscillator can identify periods when the market may be overshooting its typical boundaries, either overbought or oversold. Not only does it help traders make more informed decisions, but it also improves the accuracy of their predictions, especially when it comes to assessing the optimal times to enter or exit a trade.
What are some common oscillators used in binary trading?
Common oscillators include the Stochastic, Relative Strength Index (RSI), Average Directional Index (ADI) and Moving Averages Convergence Divergence (MACD).
What is the Awesome Oscillator in binary options trading?
The Awesome Oscillator is a simplified version of the MACD. It is a histogram designed to reflect market momentum, confirm trends and identify potential reversal points.
How do technical oscillators work in binary options trading?
In binary options trading, technical oscillators serve as advanced analytical tools that delve into the nuances of market dynamics. By examining the speed and magnitude of price fluctuations, these oscillators provide traders with a deeper understanding of market momentum. This momentum, in turn, can reveal potential overbought or oversold conditions, signalling optimal entry or exit points for trades.


